LemonBox Membership Program (2025)
A data-driven mobile membership system that leverages quantitative user analysis to optimize customer segmentation and lifetime value.
Project Overview
Project Summary
This project represents a comprehensive, end-to-end design of a digital membership ecosystem, transitioning from a generic user base to a highly structured, data-driven tiered system. Initiated by strategic goals to drive repurchase and enhance brand loyalty, the project leverages quantitative analysis of over 30,000 user data points to define precise customer segmentation. By identifying key behavioral patterns and spending thresholds, the project establishes a dynamic membership framework (Level 0-4) with a rigorous segmentation, upgrade, and fallback system that aligns user incentives with business objectives.
My Contributions
As the product manager and designer of the membership system, I collaborated closely with CEO, Dev Team, Marketing Team, and Operation Team to successfully launch the program, and was responsible for:
Quantitative Data Analysis & Segmentation
Behavioral and Outlier Study
Strategic Framework Formulation
Membership System Logic Mapping (including upgrade/fallback mechanism, benefit claiming, and edge case handling)
Design of UX/UI, Event Tracking, and Internal Data Reporting Framework
Tech Stack
Data Extract & Analysis: SQL, Python (Pandas, Matplotlib)
Strategy & Logic Mapping: Figjam, Mermaid
UX/UI Design: Figma
Business Goal & Benchmarking
Defining Business Goals & Metrics
The business strategies and goals of the membership system are structured around three core metrics:
" height="170.83333320312502px" id="bISlMndDb" transform="translate(14.583 14.583)" width="170.83333320312502px"/></svg>)
User
Implement Customer Segmentation
" height="158.3333333984375px" id="tKMmOa5ui" transform="translate(18.75 22.917)" width="158.3333333984374px"/></svg>)
Revenue
Attract New Customers & Drive Repurchase
" height="162.33056242483616px" id="D5JJp4yEU" transform="translate(15.779 11.503)" width="169.6374696588784px"/></svg>)
Brand
Integrate Existing Loyalty Strategies (Points System, Private Domain, AI Feature Integration, Annual Promotion)
" height="79.375px" id="ATynQPdI9" transform="translate(26.875 60.208)" width="145.83333339843753px"/></svg>)
Identify High-value Users
Boost Long-term Value
Enhance Brand Loyalty
Benchmarking
To help define an ideal customer segmentation, a comprehensive benchmarking analysis was conducted against loyalty programs of key industry players in the consumer product market. This phase focused on evaluating membership tier structures.
Key Findings:
Member tier is dependent on customers’ annual spending (including a dynamic annual rollback/reset mechanism).
The distributions of annual spending thresholds have a pyramid structure. Entry threshold for the initial tier is low, and the thresholds for higher tiers increase exponentially.
Tier 0 is included in all membership systems, so all users completing registering automatically become members, which is attractive to potential customers.
Data Analysis & User Clustering
Studying Historical Order Data
Raw data was pulled from the past year from the OMS and deduplicated to obtain the annual cumulative consumption amount per user.
The dataset contains around 30,000 samples. The distribution is strongly right-skewed, with a mean of approximately ¥1,500 and a median of approximately ¥750.00 .
Using the 1.5×IQR method, the upper fence sits at approximately ¥3,400, with a total of 2,639 records (8.44%) exceed this threshold and are flagged as outliers.


Identifying Key User Behavior Patterns
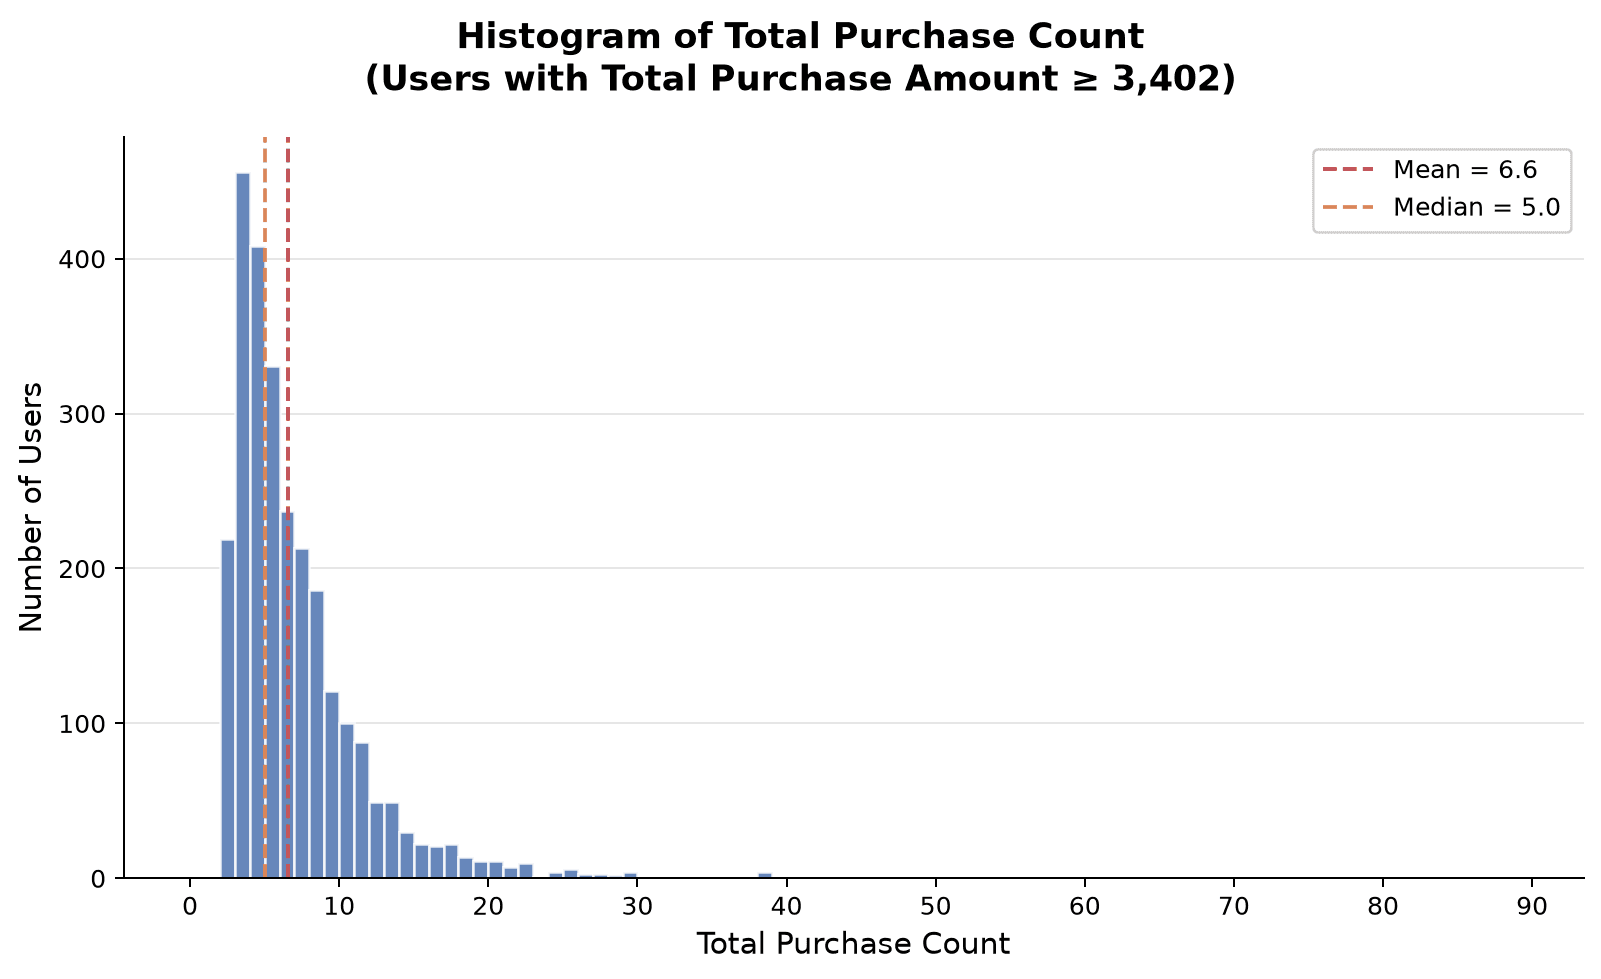
Based on a closer examination of the outliers’ purchasing behavior, a similar analytical approach was applied to map the order‑count distribution across all 2,639 identified outliers. The results show that more than 50% of these users have placed 5 or more orders.
(Given that the nutrition supplement bundle is available in both a 1‑month and a 3‑month supply—with the 3‑month option offering better cost‑effectiveness—a typical loyal customer would be expected to place roughly 3–4 orders per year.) The fact that a majority of outliers far exceed this range strongly suggests that they are not merely purchasing for their own personal use; they are very likely buying the product for others as well (e.g., family members).
Consequently, all outliers should be recognized as core users. Moreover, because their multi‑order behavior implies active advocacy and social sharing, they possess a latent viral growth potential that makes them even more valuable than conventional loyal customers.

Conclusion: Define Customer Clustering
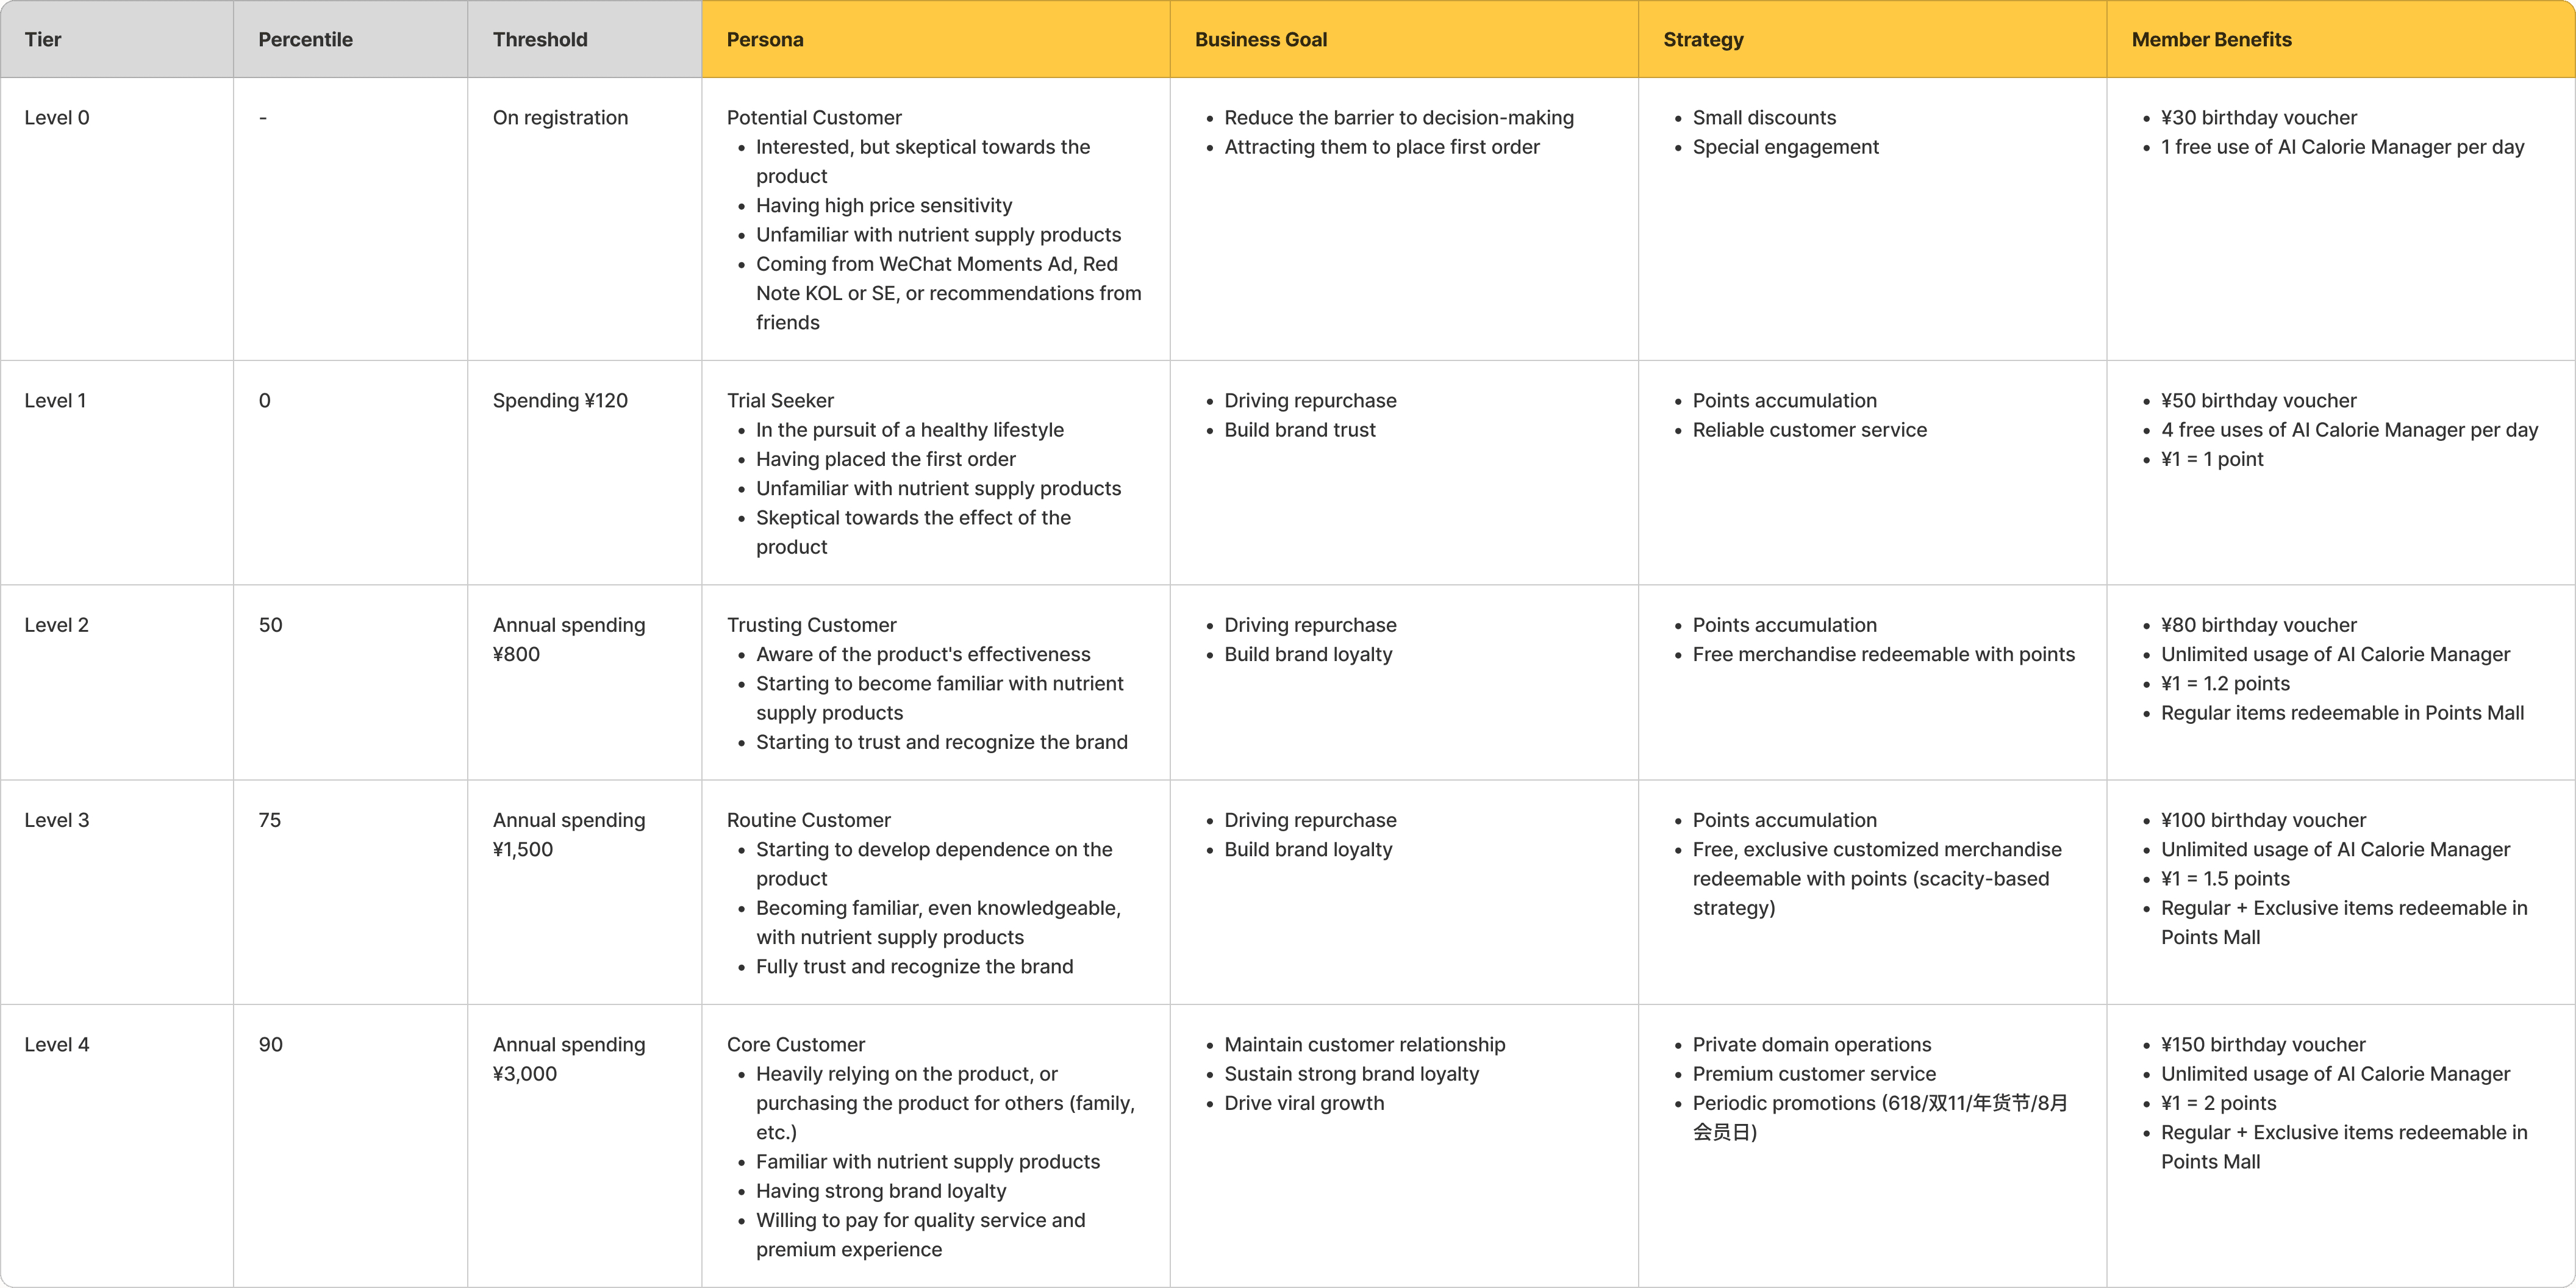
Tier 0 (potential customer): on registration (according to benchmarking)
Tier 1 (trial seeker): on first purchase (ensure maximum customer acquisition)
Tier 2 (trusting customer): medium annual order price & exceeds the price range of 1-month supply bundle (which indicates that the users want more than a 1-month trial, i.e. trust has been established)
Tier 3 (routine customer): 75 percentile annual order price & exceeds the price range of 3-month supply bundle (which indicates that the users have repurchased, i.e. habitual purchase behavior has been established)
Tier 4 (core customer & advocate): 90 percentile annual order price & involving all statistical outliers & exceeds the price range of 2*3-month supply bundle (which indicates that the users have repurchased at least twice with relatively expensive average purchases, i.e. they either heavily rely on nutrient supplies or purchase for others)
System & Mechanism Design
Member Benefits Design
Based on the customer segmentation, marketing approaches and engagement strategies are tailored to each user group.
Tier 0 & Tier 1: The primary goal is to lower the barrier to entry and convert registrations into first-time purchases. The strategy focuses on “Activation” by providing immediate, low-threshold incentives to encourage the initial transaction. (Birthday Voucher, Free Calorie Calculator Trials)
Tier 2 & Tier 3: The focus shifts to “Retention”. Unlimited usage of Calorie Calculator is used to increase recurring behavior. Enhanced point multipliers and free merchandise redeemable with points are utilized to reward repurchasing.
Tier 4: The goal is to sustain long-term loyalty and maximize customer Lifetime Value (LTV). Highest point multiplier, access to high-value merchandise, and exclusive access to periodic promotions, are used to maintain engagement and transform these customers into brand advocates.
Upgrade/Fallback Mechanism
The membership system utilizes a State Machine to manage tier transitions:
Upgrade Logic: Upgrade is triggered immediately when a user’s cumulative spending crosses the upper bound of the current tier’s threshold, granting instant access to higher-tier benefits. Skipping to a higher tier is supported if a single transaction pushes the user’s cumulative spending past the threshold of a higher tier.
Fallback Logic: The user’s eligibility to retain at the current tier is evaluated annually (1 year after the last tier change or retain). If the user’s annual spending fails to meet the retention criteria of the current tier, the user will be downgraded to the appropriate level.

Mobile Implementation
Key Flow: Registration (Based on WeChat Mini Program API)
The authentication system leverages WeChat’s getPhoneNumber API to establish a phone number-based identity framework. This process is designed to enable seamless profile migration for existing users while maintaining data integrity through phone number as the primary key (to extend membership system across multiple e-commerce platforms in the future).
Step 1: querying existing user records by phone number (which was authorized by existing users when they made the first transaction).
Step 2: calculating historical transaction data from the past 365 days for legacy users.
Step 3: automatically assign initial membership tier based on cumulative spending thresholds.
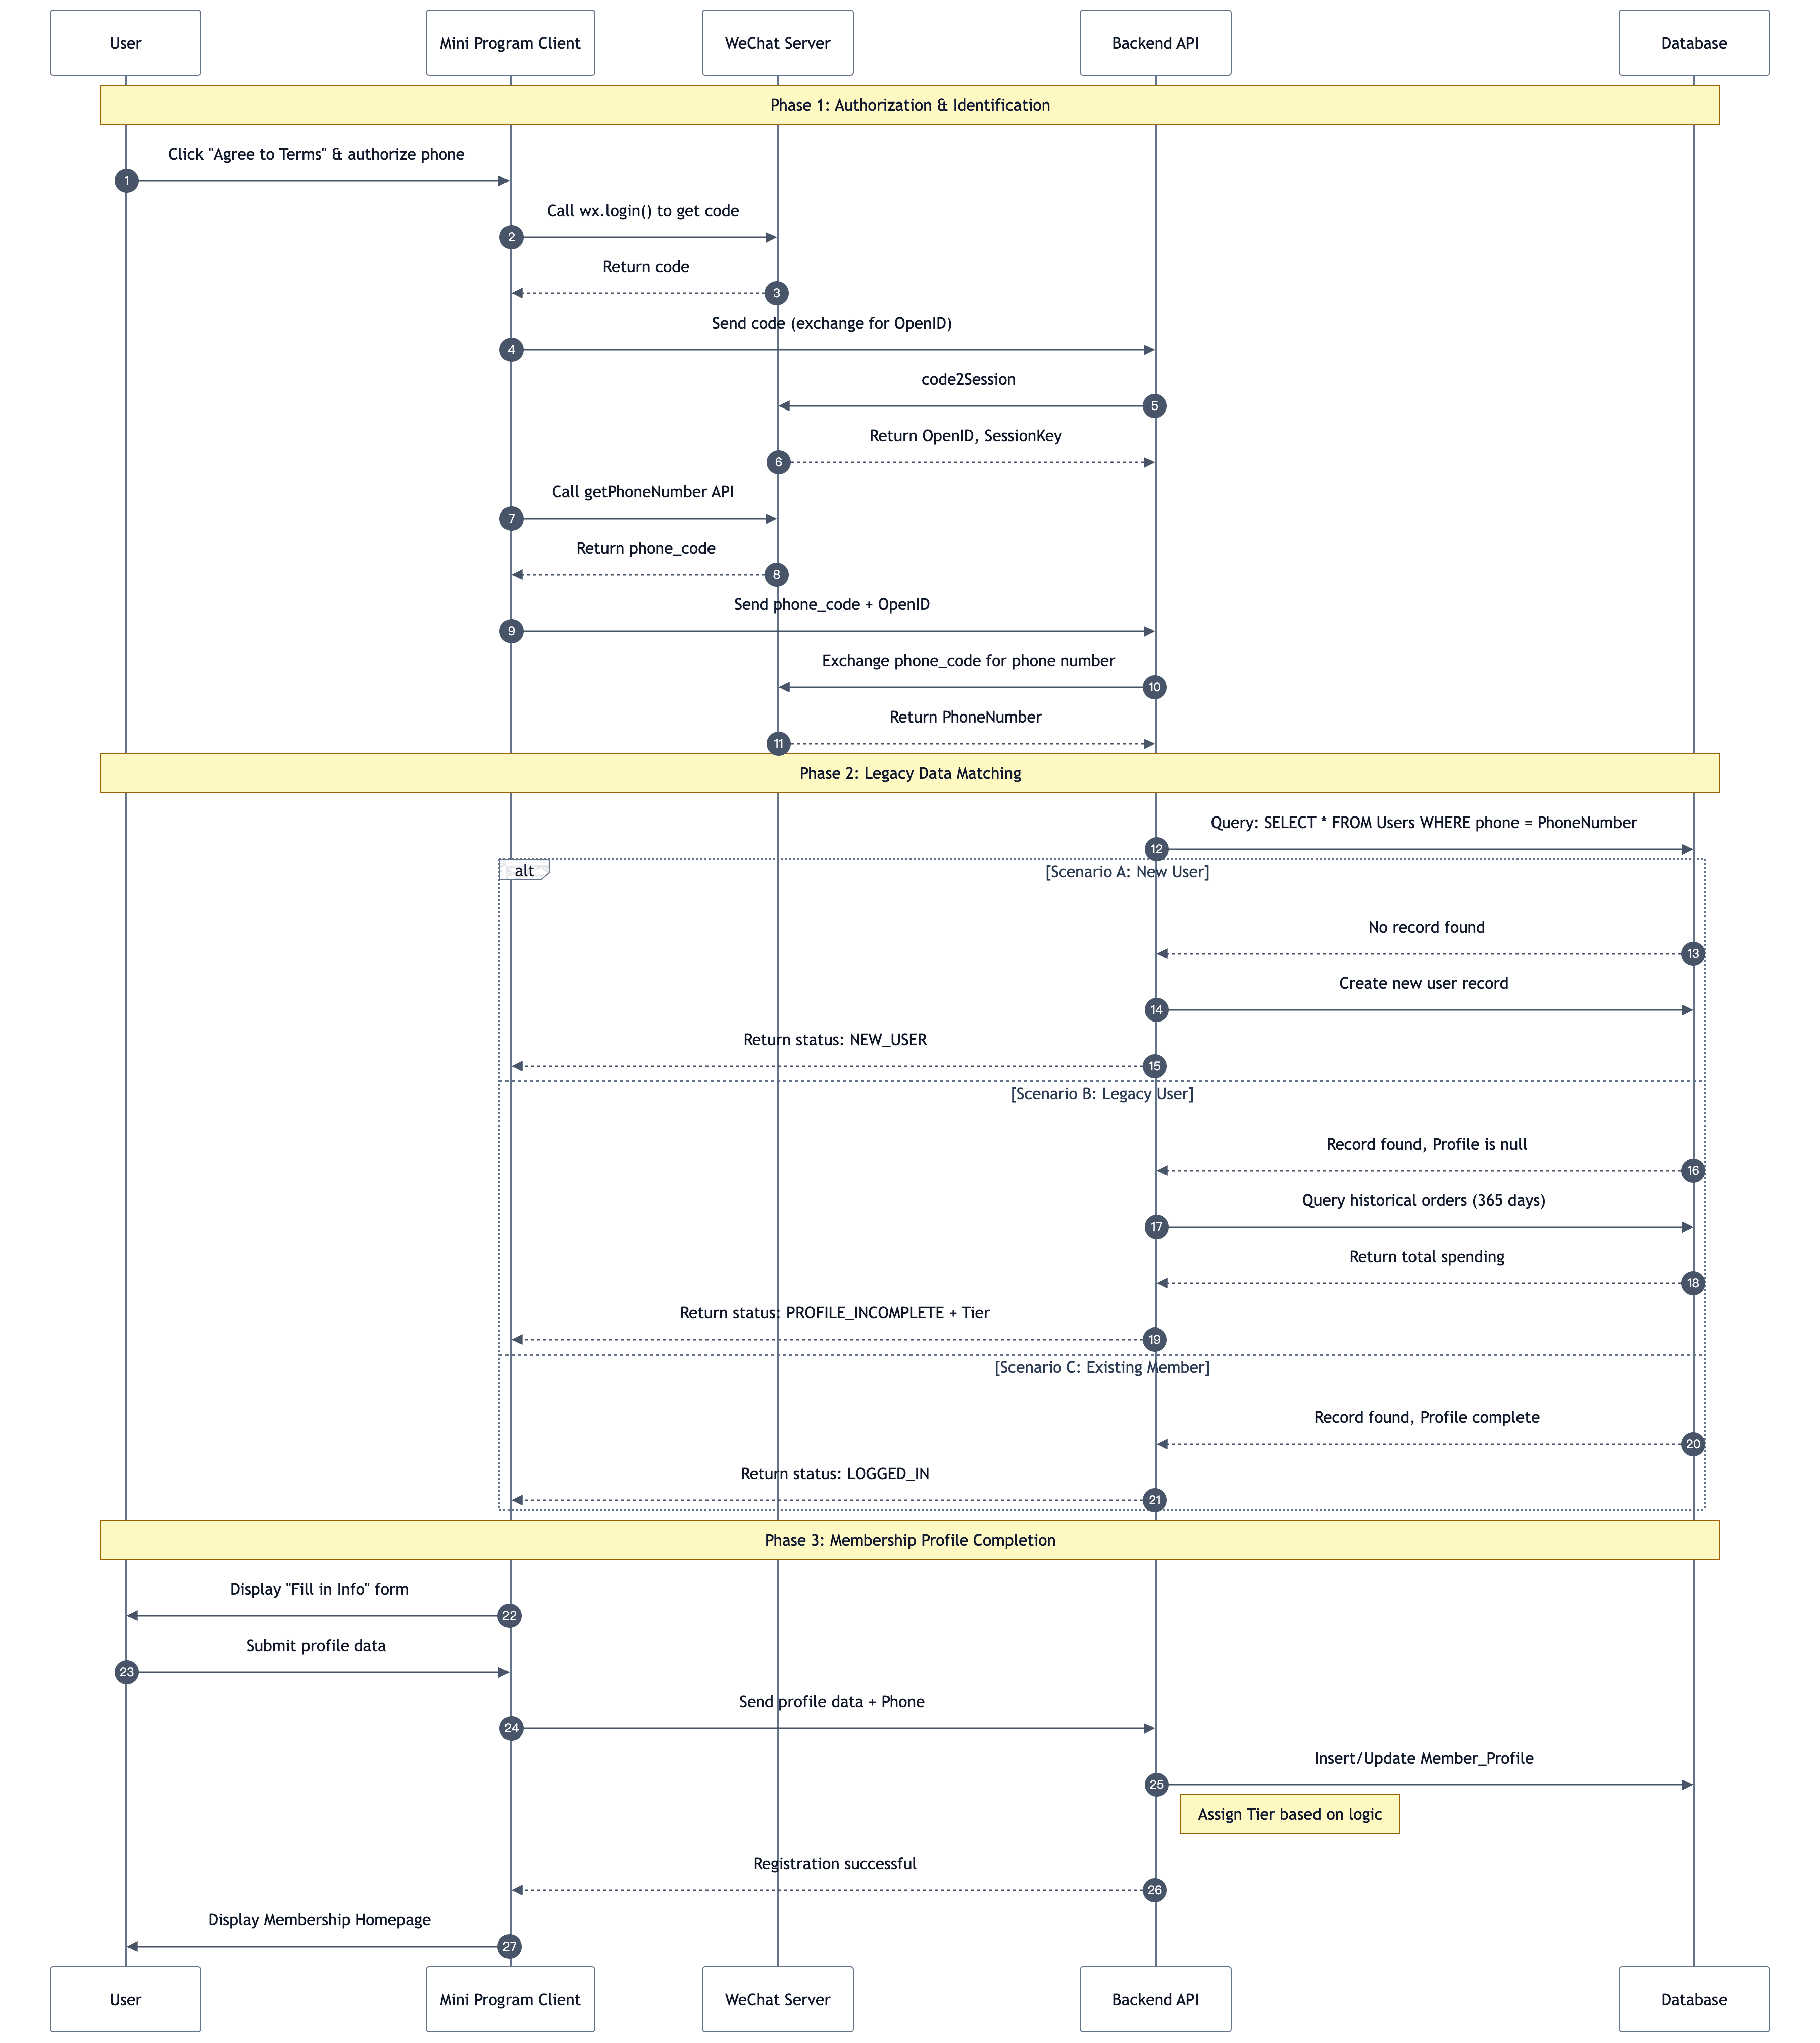
The user flow is designed based on the technical implementation using WeChat Mini Program APIs.
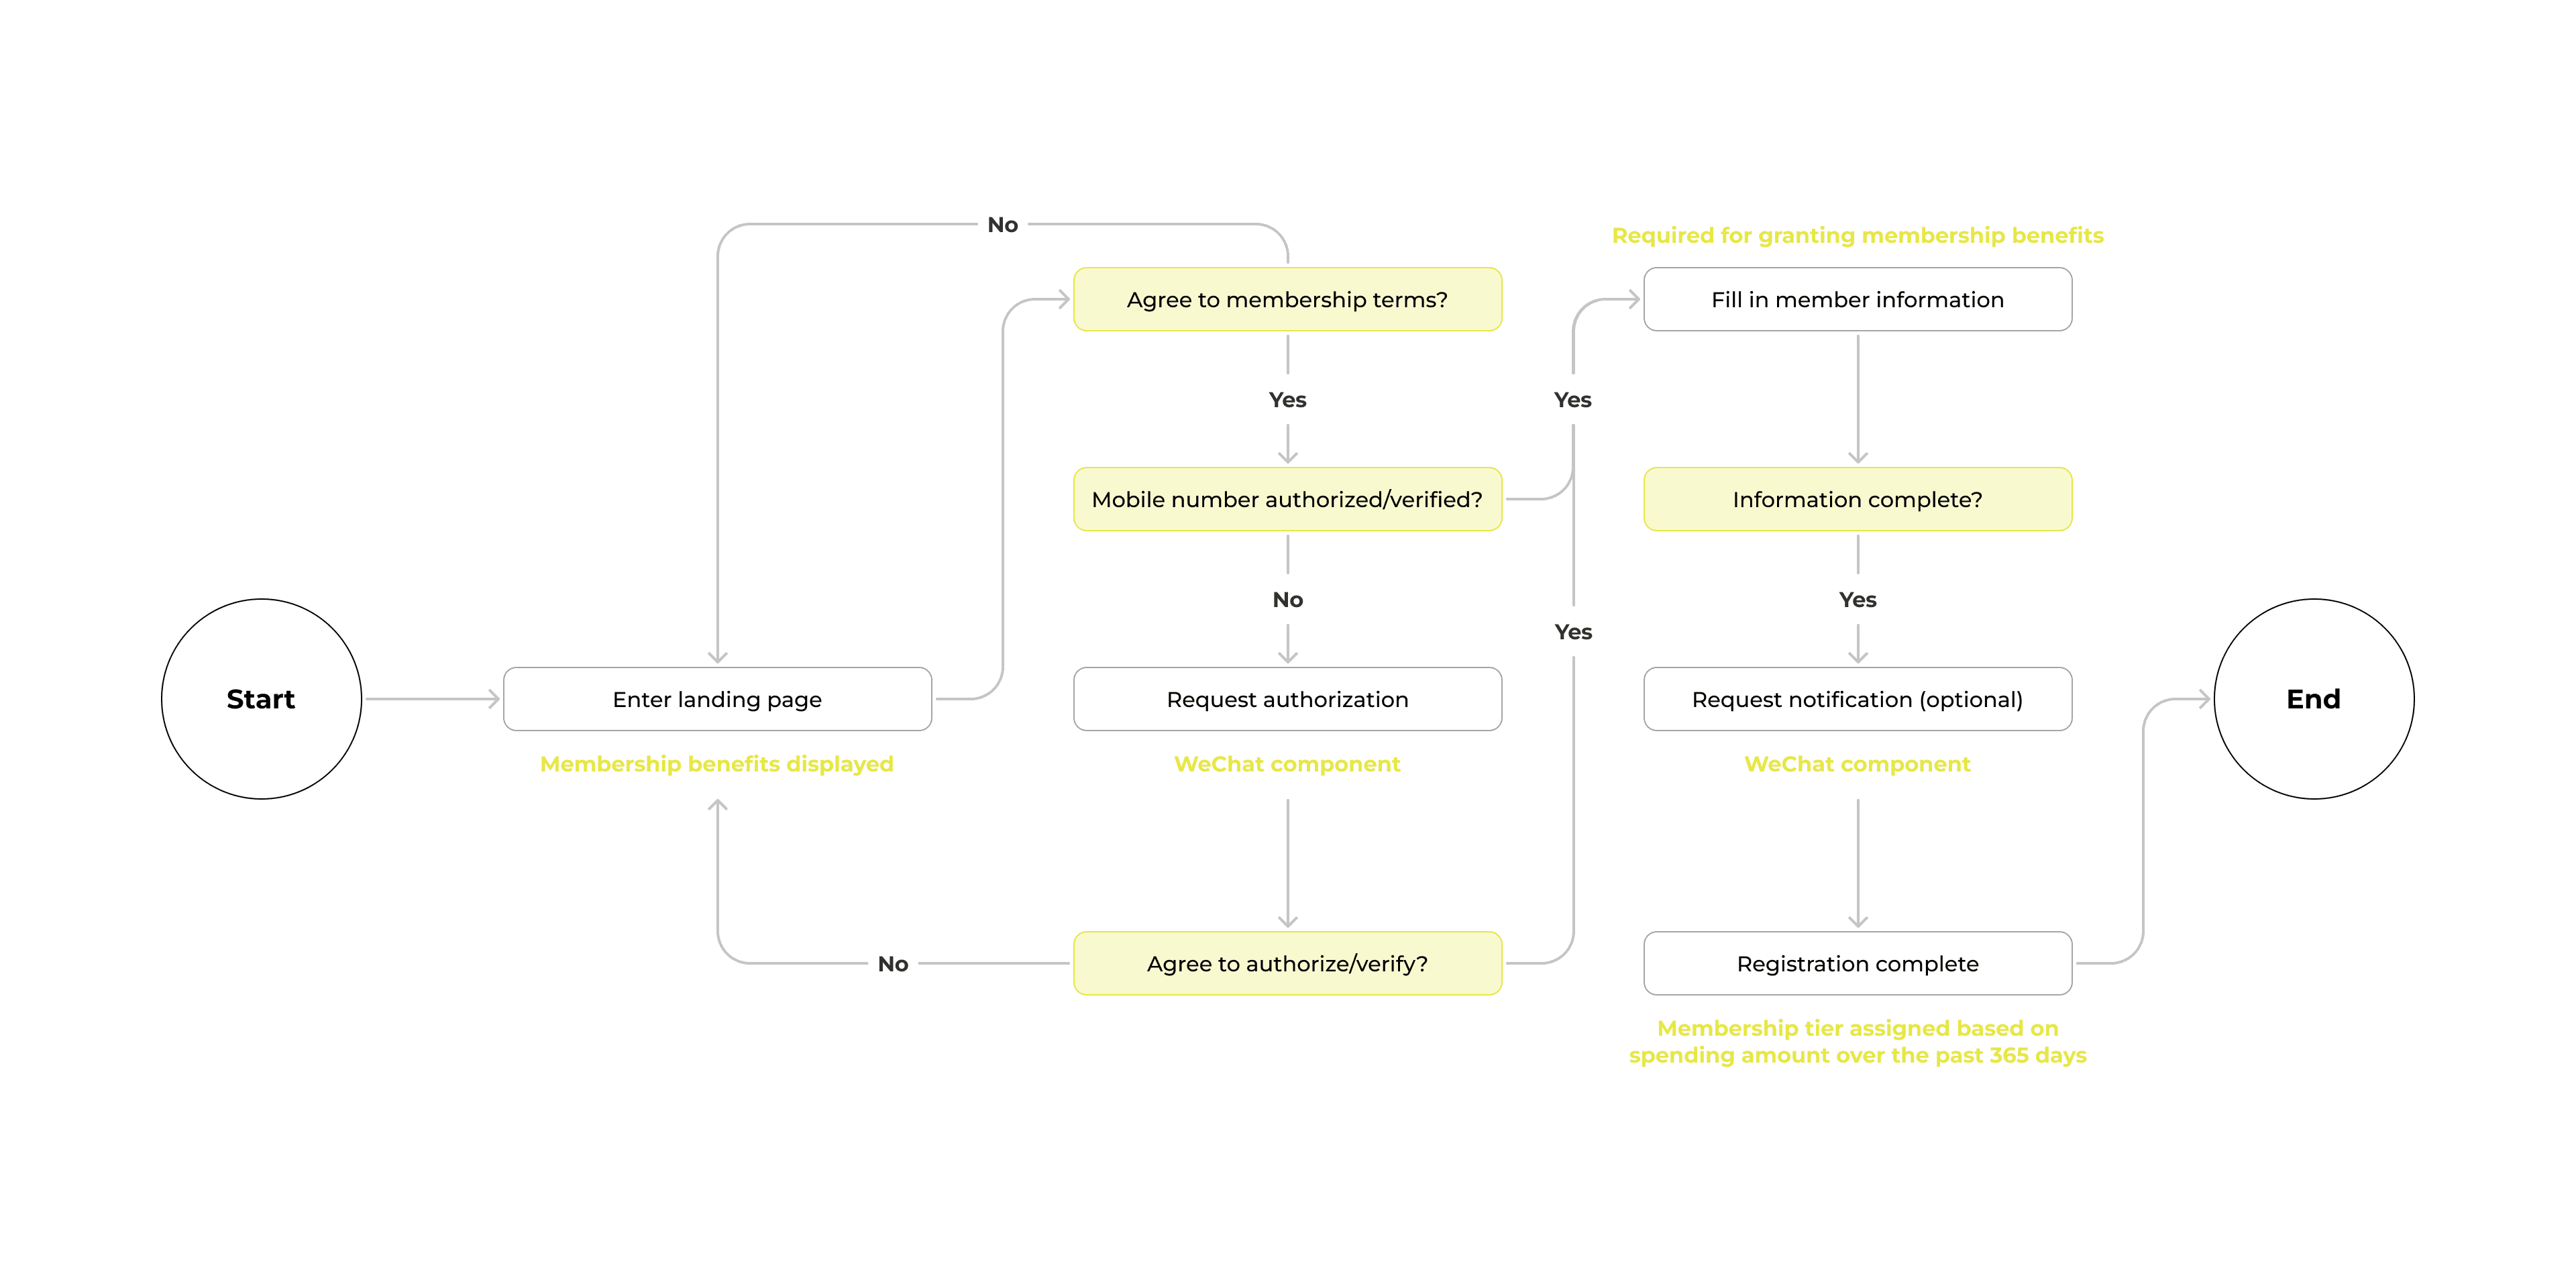
The registration flow begins on a landing page displaying benefits. Users must first agree to membership terms and verify their mobile number (via WeChat authorization); declining either step returns them to the landing page. Once verified, users fill in required member information to unlock benefits. The flow concludes with an optional notification request, after which registration is complete and a membership tier is assigned based on the user’s spending over the past 365 days.

Supporting Flow: Updated Points Mall
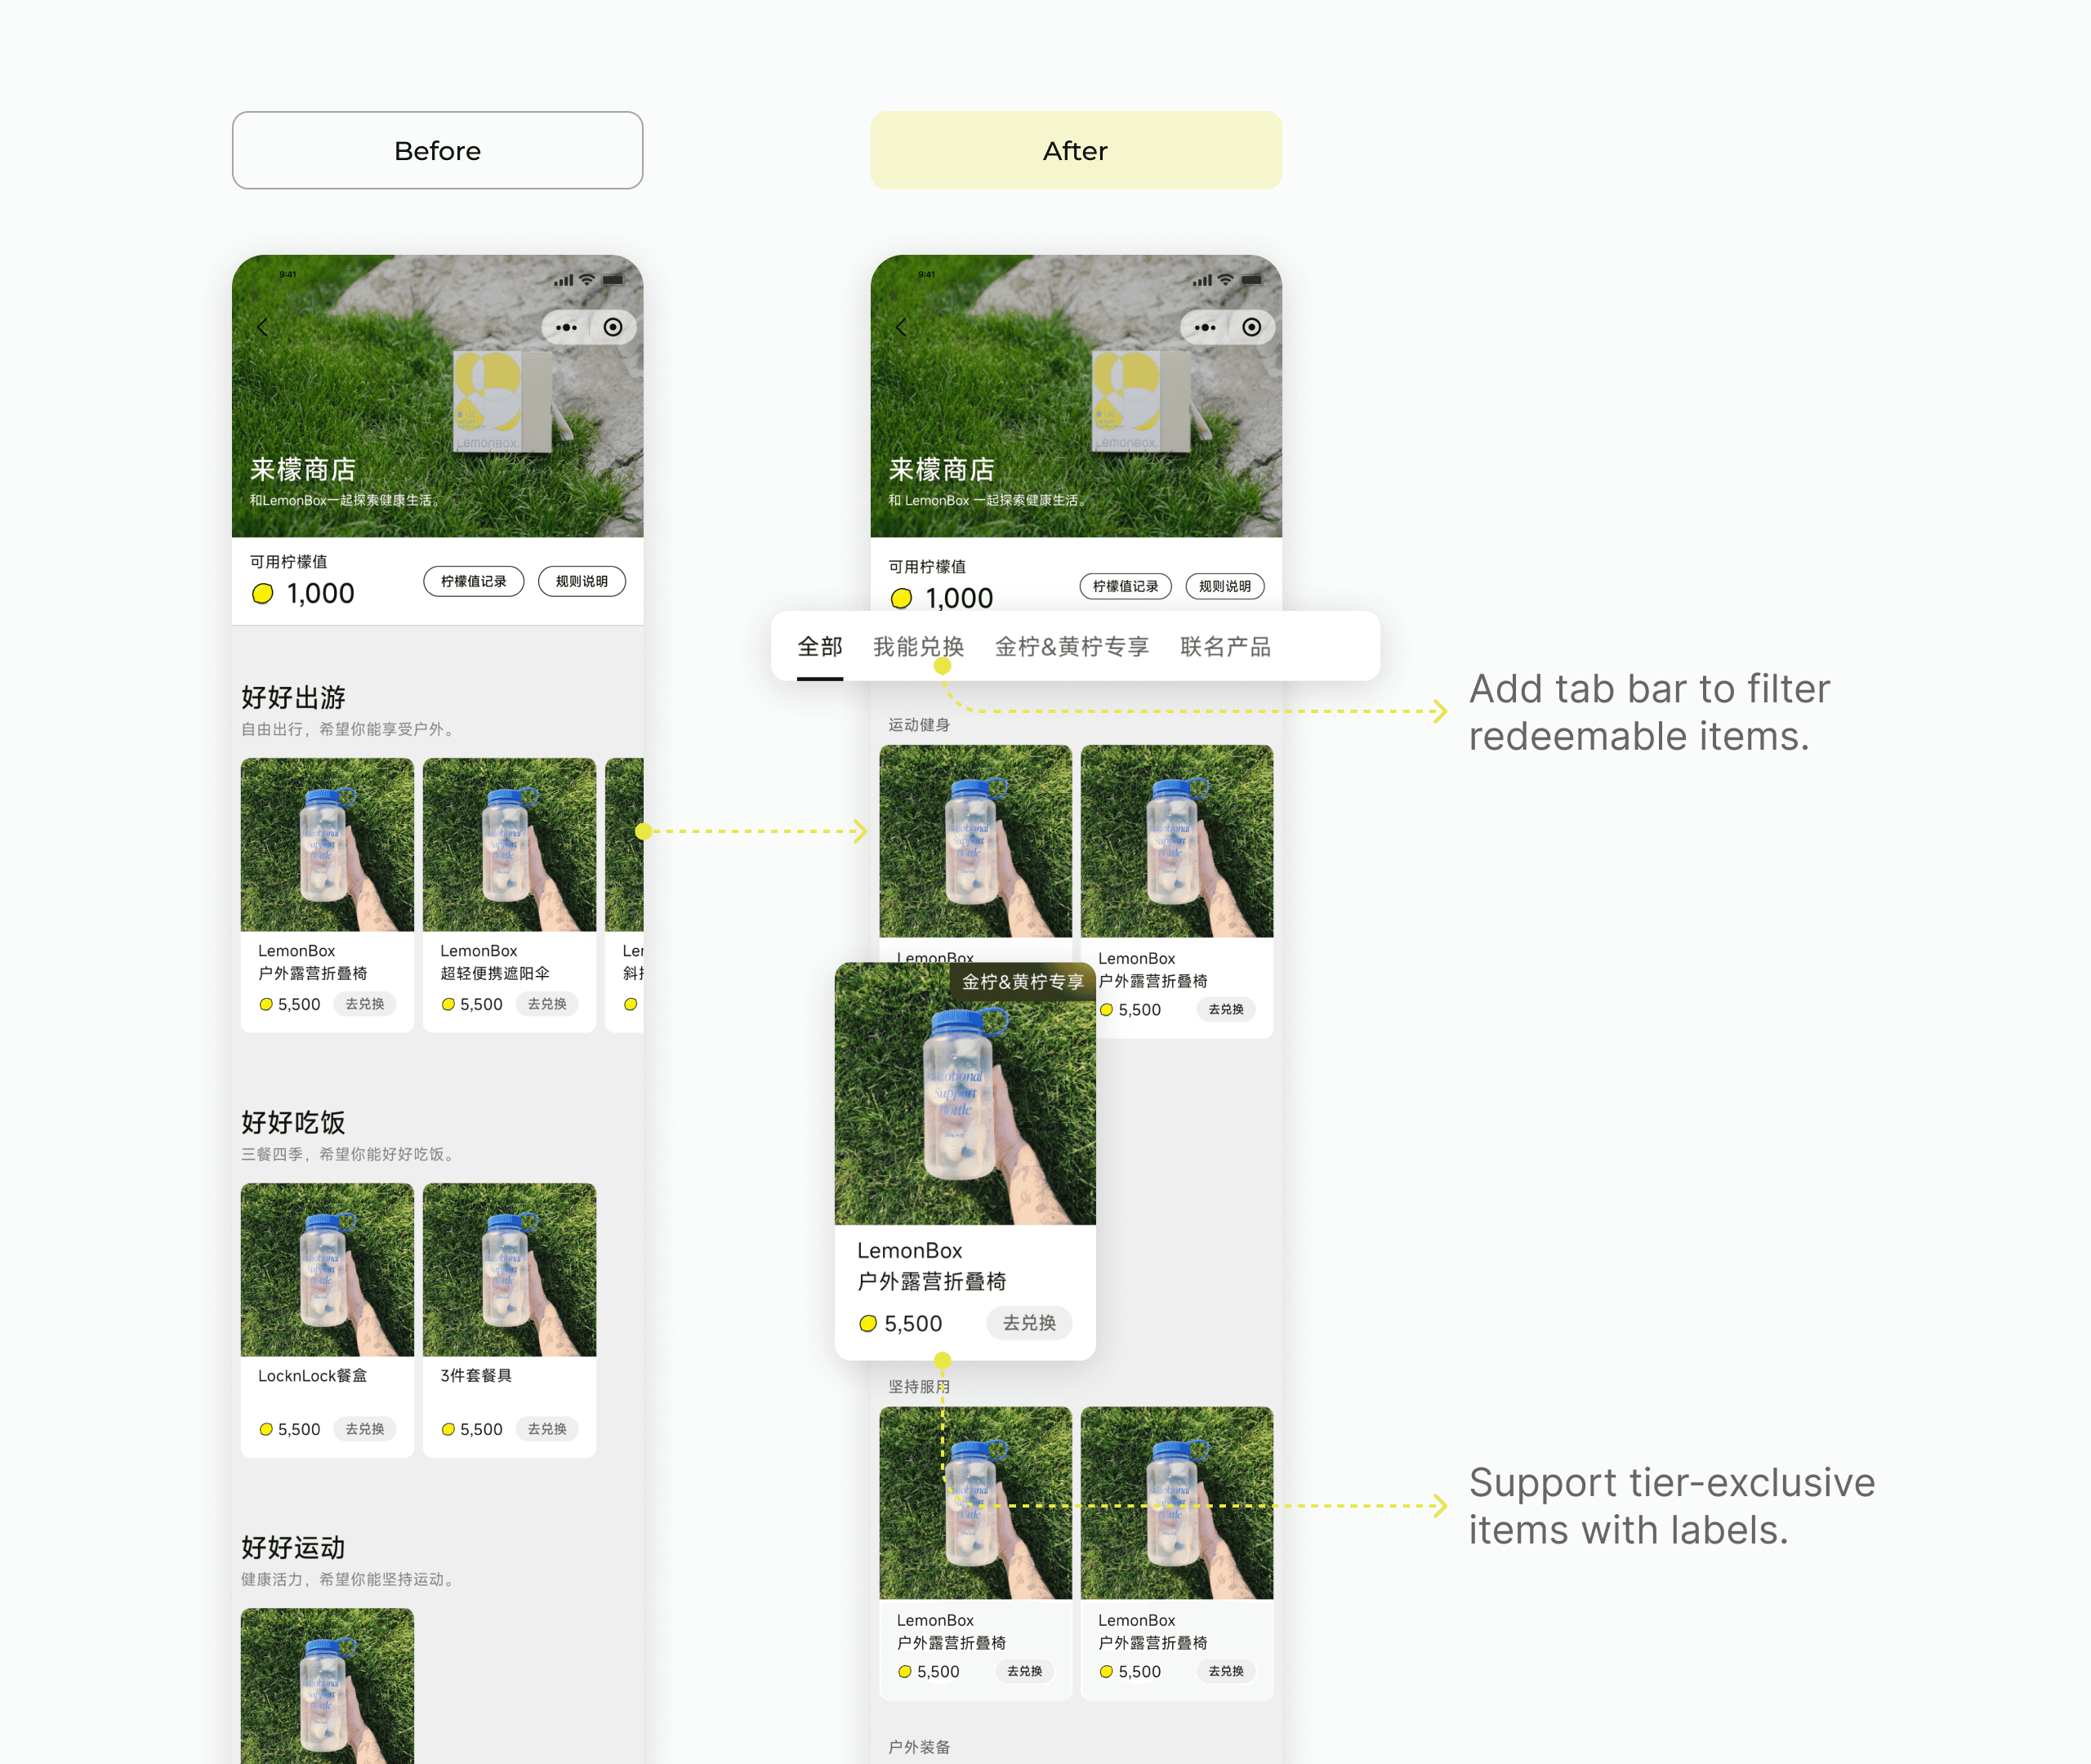
The Points Mall was redesigned to implement tier-exclusive items, enhance navigation efficiency, and reduce redemption effort. The product selection strategy was also optimized using AI-driven analysis on stratified user personas.

Supporting Flow: Birthday Voucher
An automated birthday voucher system was designed to offer personalized voucher on the first day of each member’s birthday month, valid for 30 days. The system integrates with the member profile database to track birthday information (immutable post-registration) and automatically triggers voucher distribution via scheduled jobs.

Project Outcome – 11-Month Post-Launch Review
The program went live on 2025-07-23. In June 2026 — 11 months post-launch, and with LemonBox's consent — I obtained the membership master table (around 29,000 valid members) and the sales dashboard to run an independent post-launch review, closing the loop on the original design issues.
Overall, the segmentation mechanism works. The percentiles of actual users at different tiers are relatively close to the designed percentiles. Average spending and order frequency rise monotonically with tier.
Monthly buyer penetration holds steady at roughly 50%, with members accounting for 46–62% of all buyers. Meanwhile, the legacy migration executed well as designed: in the launch month, only 46% of new members entered at Lv0 (indicating that the rest 54% were existing high‑value customers absorbed directly into Lv1–4 through the 365‑day retroactive assignment batch), validating the intended migration logic and preserving loyalty equity from day one.
" height="173.3573819462307px" id="uYSDJXpWY" transform="translate(13 13.5)" width="174px"/></svg>)